PowerShell for Developers

Build Vega-Lite HTML Reports with PowerShell

• 7 min read
Share:

PowerShell is good at acquiring data and turning it into objects. Vega-Lite is good at turning structured data into interactive graphics. A small function is enough to connect the two without adopting a reporting framework or opening a browser from the script.

In this article, we download the Palmer Penguins dataset, clean it with ordinary PowerShell, describe three views as one Vega-Lite specification, and save the finished report as an HTML file.

The key design choice is that Show-VegaLite doesn’t decide what to do with the HTML. It returns the document to the pipeline:

1
2
3
$reportSpec |
    Show-VegaLite -PageTitle 'Palmer Penguins report' |
    Set-Content -Path ./penguins-report.html -Encoding utf8

That makes the renderer useful in a console script, scheduled job, CI pipeline, or notebook.

The finished report

The example produces one HTML document containing a bar chart, scatter plot, and box plot.
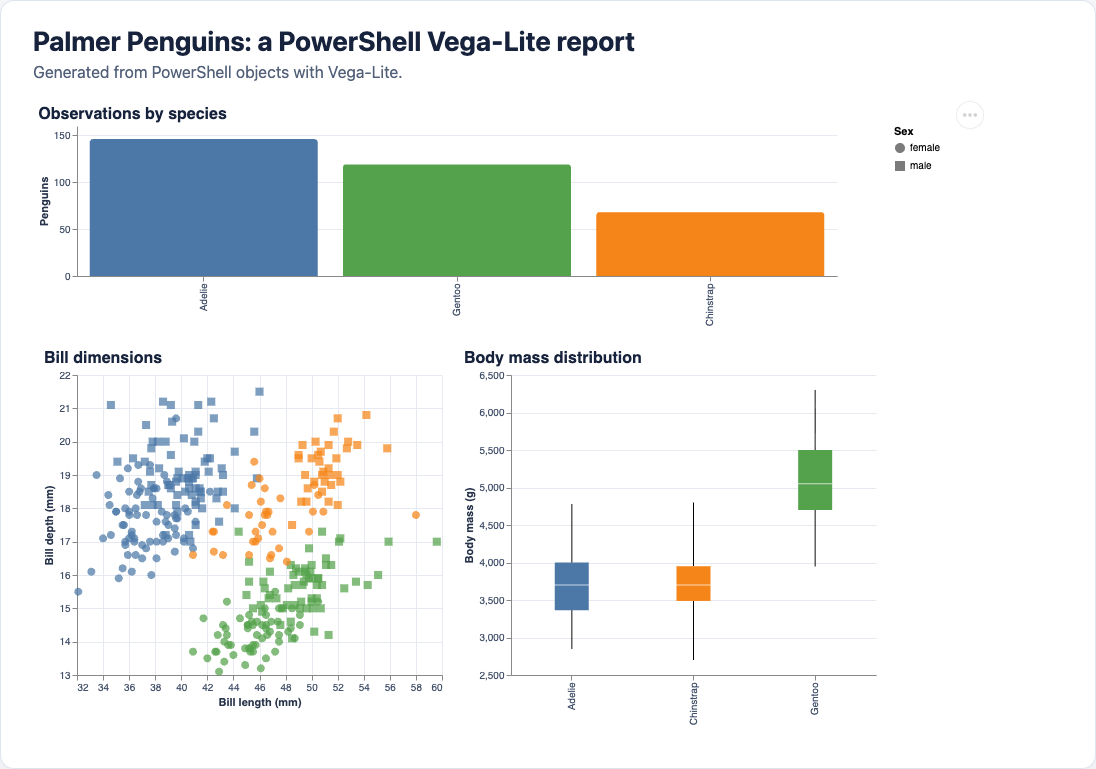
Palmer Penguins HTML report generated from PowerShell objects with Vega-Lite

The charts answer progressively richer questions:

  • How many complete observations are available for each species?
  • How do bill length and bill depth separate the species?
  • How different are the body-mass distributions?

The saved report remains interactive. Vega-Embed provides tooltips and an action menu that can export individual views.

Load and shape the data

The simplified Palmer Penguins dataset has 344 rows and eight columns. It contains categories, measurements, missing values, and several visible relationships, which makes it a useful alternative to the classic Iris dataset. The project publishes the data under CC0 and documents the original Palmer Station LTER sources.

PowerShell can download the CSV directly:

 1
 2
 3
 4
 5
 6
 7
 8
 9
10
11
12
13
14
15
16
17
18
19
20
21
22
23
24
$dataUrl = 'https://raw.githubusercontent.com/' +
    'allisonhorst/palmerpenguins/main/inst/extdata/penguins.csv'

$penguins = Invoke-RestMethod -Uri $dataUrl |
    ConvertFrom-Csv |
    Where-Object {
        $_.bill_length_mm -ne 'NA' -and
        $_.bill_depth_mm -ne 'NA' -and
        $_.flipper_length_mm -ne 'NA' -and
        $_.body_mass_g -ne 'NA' -and
        $_.sex -ne 'NA'
    } |
    ForEach-Object {
        [pscustomobject]@{
            species           = $_.species
            island            = $_.island
            bill_length_mm    = [double]$_.bill_length_mm
            bill_depth_mm     = [double]$_.bill_depth_mm
            flipper_length_mm = [int]$_.flipper_length_mm
            body_mass_g       = [int]$_.body_mass_g
            sex               = $_.sex
            year              = [int]$_.year
        }
    }

The explicit casts matter. ConvertFrom-Csv initially creates strings, while Vega-Lite should receive JSON numbers for quantitative fields. Removing incomplete records keeps this example focused. A production report could retain them and add a separate data-quality summary.

Describe several charts in one specification

Vega-Lite specifications are JSON documents. PowerShell ordered hashtables and arrays let us construct the same structure while keeping the data as objects until the final serialization step.

The top-level data property makes the cleaned data available to every view. vconcat places the count chart above an hconcat containing the scatter and box plots:

  1
  2
  3
  4
  5
  6
  7
  8
  9
 10
 11
 12
 13
 14
 15
 16
 17
 18
 19
 20
 21
 22
 23
 24
 25
 26
 27
 28
 29
 30
 31
 32
 33
 34
 35
 36
 37
 38
 39
 40
 41
 42
 43
 44
 45
 46
 47
 48
 49
 50
 51
 52
 53
 54
 55
 56
 57
 58
 59
 60
 61
 62
 63
 64
 65
 66
 67
 68
 69
 70
 71
 72
 73
 74
 75
 76
 77
 78
 79
 80
 81
 82
 83
 84
 85
 86
 87
 88
 89
 90
 91
 92
 93
 94
 95
 96
 97
 98
 99
100
101
102
103
104
105
106
107
108
109
110
111
112
113
114
115
116
117
118
$reportSpec = [ordered]@{
    '$schema' = 'https://vega.github.io/schema/vega-lite/v6.json'
    data      = @{ values = @($penguins) }
    spacing   = 24
    vconcat   = @(
        @{
            width    = 760
            height   = 150
            title    = 'Observations by species'
            mark     = @{ type = 'bar'; cornerRadiusEnd = 3 }
            encoding = @{
                x = @{
                    field = 'species'
                    type  = 'nominal'
                    title = $null
                    sort  = '-y'
                }
                y = @{
                    aggregate = 'count'
                    type      = 'quantitative'
                    title     = 'Penguins'
                }
                color = @{
                    field  = 'species'
                    type   = 'nominal'
                    legend = $null
                }
                tooltip = @(
                    @{ field = 'species'; type = 'nominal'; title = 'Species' }
                    @{ aggregate = 'count'; type = 'quantitative'; title = 'Observations' }
                )
            }
        }
        @{
            hconcat = @(
                @{
                    width  = 365
                    height = 300
                    title  = 'Bill dimensions'
                    mark   = @{
                        type    = 'point'
                        filled  = $true
                        opacity = 0.72
                        size    = 65
                    }
                    encoding = @{
                        x = @{
                            field = 'bill_length_mm'
                            type  = 'quantitative'
                            title = 'Bill length (mm)'
                            scale = @{ zero = $false }
                        }
                        y = @{
                            field = 'bill_depth_mm'
                            type  = 'quantitative'
                            title = 'Bill depth (mm)'
                            scale = @{ zero = $false }
                        }
                        color = @{
                            field = 'species'
                            type  = 'nominal'
                            title = 'Species'
                        }
                        shape = @{
                            field = 'sex'
                            type  = 'nominal'
                            title = 'Sex'
                        }
                    }
                }
                @{
                    width  = 365
                    height = 300
                    title  = 'Body mass distribution'
                    mark   = @{
                        type   = 'boxplot'
                        extent = 'min-max'
                        size   = 34
                    }
                    encoding = @{
                        x = @{
                            field = 'species'
                            type  = 'nominal'
                            title = $null
                        }
                        y = @{
                            field = 'body_mass_g'
                            type  = 'quantitative'
                            title = 'Body mass (g)'
                            scale = @{ zero = $false }
                        }
                        color = @{
                            field  = 'species'
                            type   = 'nominal'
                            legend = $null
                        }
                    }
                }
            )
        }
    )
    config = @{
        view  = @{ stroke = $null }
        axis  = @{
            labelColor = '#42506a'
            titleColor = '#27334a'
            gridColor  = '#e6eaf0'
        }
        title = @{
            anchor   = 'start'
            color    = '#17233c'
            fontSize = 16
        }
        range = @{
            category = @('#4c78a8', '#f58518', '#54a24b')
        }
    }
}

This is still only data. No chart process has started, and PowerShell hasn’t emitted HTML yet.

Return HTML instead of taking control

Show-VegaLite performs four operations:

  1. Serialize the specification with enough JSON depth for nested encodings.
  2. Encode that JSON as UTF-8 Base64 to avoid quoting and </script> problems inside the page.
  3. Create a small HTML document that loads pinned Vega, Vega-Lite, and Vega-Embed versions.
  4. Return the document as a string.
 1
 2
 3
 4
 5
 6
 7
 8
 9
10
11
12
13
14
15
16
17
18
19
20
21
22
23
24
25
26
27
28
29
30
31
32
33
34
35
36
37
38
39
40
41
42
43
44
45
46
47
48
49
50
51
52
53
54
55
56
57
58
59
60
61
62
function Show-VegaLite {
    [CmdletBinding()]
    param(
        [Parameter(Mandatory, ValueFromPipeline)]
        [System.Collections.IDictionary]$Spec,

        [string]$PageTitle = 'Vega-Lite report',

        [ValidateSet('svg', 'canvas')]
        [string]$Renderer = 'svg'
    )

    process {
        $specJson = $Spec | ConvertTo-Json -Depth 100 -Compress
        $specBase64 = [Convert]::ToBase64String(
            [Text.Encoding]::UTF8.GetBytes($specJson)
        )
        $encodedTitle = [Net.WebUtility]::HtmlEncode($PageTitle)

        @"
<!doctype html>
<html lang="en">
<head>
  <meta charset="utf-8">
  <meta name="viewport" content="width=device-width, initial-scale=1">
  <title>$encodedTitle</title>
  <script src="https://cdn.jsdelivr.net/npm/vega@6.3.1"></script>
  <script src="https://cdn.jsdelivr.net/npm/vega-lite@6.4.3"></script>
  <script src="https://cdn.jsdelivr.net/npm/vega-embed@7.1.0"></script>
  <style>
    body { font-family: system-ui, sans-serif; margin: 2rem; }
    #vis { overflow-x: auto; }
    .error { color: #a61b1b; white-space: pre-wrap; }
  </style>
</head>
<body>
  <h1>$encodedTitle</h1>
  <div id="vis"></div>
  <script>
    const binary = atob("$specBase64");
    const bytes = Uint8Array.from(
      binary,
      character => character.charCodeAt(0)
    );
    const spec = JSON.parse(new TextDecoder().decode(bytes));

    vegaEmbed("#vis", spec, {
      mode: "vega-lite",
      renderer: "$Renderer",
      actions: true
    }).catch(error => {
      const message = document.createElement("div");
      message.className = "error";
      message.textContent = error.stack || error.message;
      document.querySelector("#vis").replaceChildren(message);
    });
  </script>
</body>
</html>
"@
    }
}

The function doesn’t call Set-Content, Out-File, Start-Process, or a notebook-specific display command. That separation lets the caller choose the destination.

Save the report

Pipe the specification through the renderer and save the returned string:

1
2
3
4
5
6
7
$outputPath = Join-Path $PWD 'penguins-report.html'

$reportSpec |
    Show-VegaLite -PageTitle 'Palmer Penguins report' |
    Set-Content -Path $outputPath -Encoding utf8

Get-Item $outputPath

The resulting file contains the selected data and complete Vega-Lite specification. You can attach it to a ticket, publish it as a build artifact, copy it to static hosting, or open it locally.

It isn’t completely offline: the HTML contains the data and chart definition, but it loads the JavaScript runtimes from jsDelivr. A fully offline variant can download those runtime files and reference local copies, at the cost of shipping several additional assets.

Reuse the same output elsewhere

Returning HTML to the pipeline leaves room for other destinations. For example, a host that supports rich MIME output can render the same document directly:

1
2
3
$reportSpec |
    Show-VegaLite |
    Display -MimeType 'text/html'

The boundary stays simple: PowerShell prepares objects, Vega-Lite describes the visualization, and the last command decides whether the result becomes a file, build artifact, web page, or interactive cell.

References

About the Author

Andrey Vernigora avatar

Andrey

Developer platforms, PowerShell, Azure, and observable systems

I am a hands-on software architect with more than 20 years of experience building developer platforms, delivery automation, and production infrastructure. I work primarily with PowerShell, C#/.NET, and Azure, turning infrastructure complexity into application-centric self-service workflows using CI/CD, GitOps, Kubernetes, infrastructure as code, and observability.

I build PowerShell tools and write about Azure automation, graph-based infrastructure analysis, messaging, and data visualization. My open-source projects include PSQuickGraph, PSGraphView, ipmgmt, and pubs.

View profile

Related Articles